AI Reporting and Analytics Dashboard Australia | Real-Time Intelligence Always On | Unlock AI
AI Reporting and Analytics Australia

Stop Building Reports. Start Reading Insights.

Most businesses spend 10 or more hours per week building the same reports manually. AI builds them automatically, updates them in real time and surfaces the insights that actually matter.

Build My DashboardSee How It Works
0Saved on Reporting Per Week
0Real-Time Data
0Faster Decision Making
0Intelligence Always On
What an AI Reporting Dashboard Does

Every Number You Need. Without Touching a Spreadsheet.

Manual reporting is one of the most significant wastes of time in most businesses. Pulling data from multiple systems, building charts, writing summaries work that is already obsolete by the time it is finished.

We build AI reporting systems that connect to every data source in your business your CRM, your accounting software, your marketing platforms, your ecommerce store, your support system and produce live, accurate dashboards that update automatically.

Beyond the numbers, the AI surfaces insights which metrics are trending in the wrong direction, which marketing channels are underperforming, which customers are at risk of churning. You spend less time looking at data and more time acting on it.
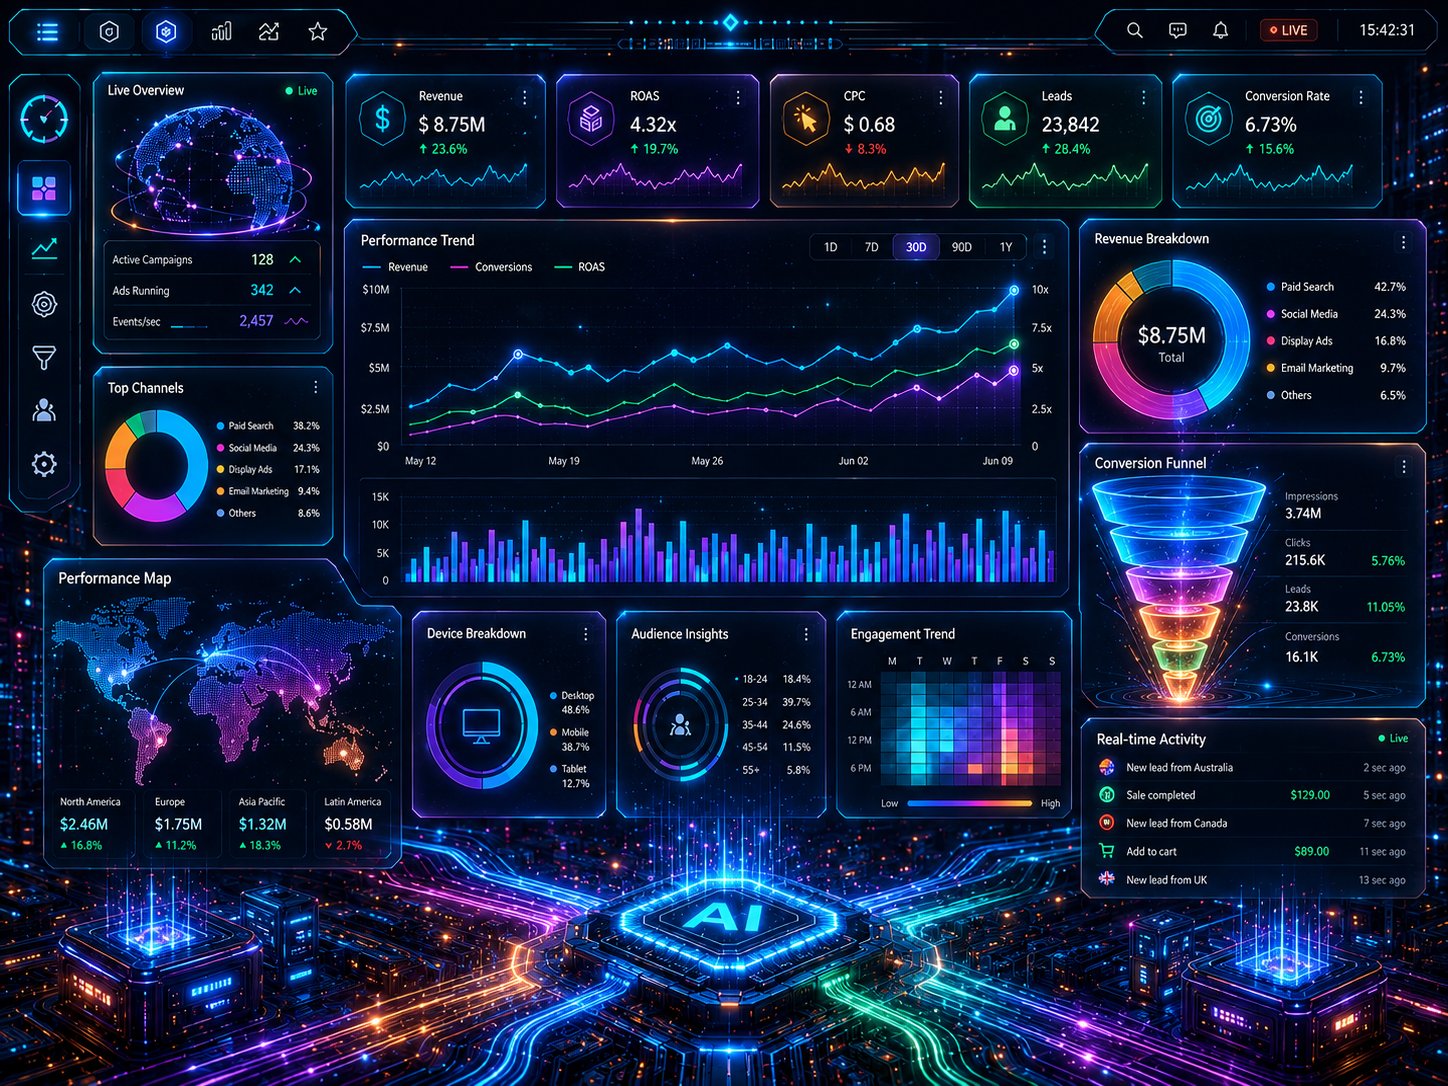

AI Reporting and Analytics Dashboard
What We Build

Six Capabilities. One Integrated System.

Every system built around your business goals and existing tools.

Integration

Multi-Source Data Integration

Connect every system your business uses CRM, accounting, marketing, ecommerce, support. All data in one place, automatically synced, always current.

Dashboards

Live Business Dashboards

Executive dashboards, department dashboards, campaign dashboards built to your specifications and updating in real time. No manual refresh, no stale numbers.

Insights

AI-Generated Insights

Beyond charts and numbers. AI identifies trends, flags anomalies, surfaces opportunities and sends alerts when metrics move outside acceptable ranges. Insight not just data.

Automation

Automated Report Distribution

Weekly, monthly and quarterly reports generated and sent automatically to the right stakeholders. No one needs to remember to pull the numbers.

Forecasting

Revenue and Performance Forecasting

AI models predict revenue, cash flow, customer churn and inventory needs based on historical patterns and current trends. Plan ahead with confidence.

Custom

Custom KPI Tracking

Every metric that matters to your specific business tracked and displayed. Not generic templates KPIs defined around your actual business model and growth goals.

AI city
The Reporting Gap

Your Competitors Are Reading Insights While You Build Reports.

Every hour your team spends building reports manually is an hour they are not spending on the work those reports are supposed to inform. AI eliminates reporting lag permanently.

Real-time intelligence. Zero reporting effort.

Build My Dashboard
Honest Assessment

Powerful When Done Right. Realistic Expectations Required.

Where It Delivers
Eliminates reporting as a bottleneck. When reports update automatically, decisions do not wait for the monthly reporting cycle. Issues get identified and addressed in real time rather than retrospectively.
Connects siloed data for the first time. Most businesses have data spread across 5 to 15 different systems that never talk to each other. An integrated dashboard creates a single source of truth that leadership can actually use.
Anomaly detection catches problems early. AI monitoring that alerts when a metric drops unexpectedly catches problems before they become crises. Early intervention is dramatically cheaper than late intervention.
Where to Be Realistic
Data quality determines insight quality. AI can only analyse the data it receives. If your source systems have poor data quality missing fields, inconsistent categorisation, duplicate records the dashboard will reflect that. Data hygiene is a prerequisite.
Integration complexity varies by system. Some systems have excellent APIs that make integration straightforward. Others require custom connectors or data export pipelines. We scope this clearly before you commit.
Dashboards need to be used to be valuable. A dashboard no one looks at delivers no value. We design for adoption simple, clear, relevant metrics for each audience and include a training handover so your team actually uses what we build.

Our approach: We start by identifying the five metrics that matter most to each key decision maker in your business. Build those first. Prove the value. Then expand to the full intelligence layer.

Common Questions

Straight Answers.

What data sources can you connect? +
Xero, MYOB, QuickBooks, Salesforce, HubSpot, Google Analytics, Meta Ads, Google Ads, Shopify, WooCommerce, Klaviyo, and most platforms with an API. If you use something specific, ask us and we will confirm.
How long does it take to build and launch? +
A core dashboard with 3 to 5 data sources typically takes 2 to 4 weeks. More complex multi-source, multi-department implementations take 4 to 8 weeks.
Can different team members see different dashboards? +
Yes. We build role-specific dashboards with appropriate data visibility. The CEO sees the business overview. The marketing team sees marketing performance. Finance sees financial metrics.
What happens when a metric goes outside normal range? +
Automated alerts are sent via email or Slack to the relevant person. The alert includes the metric, how far it has moved from baseline and a link to the relevant dashboard section for investigation.
Get Started

Build Your Business Intelligence Dashboard.

Tell us what systems you use, what metrics you track most often and your biggest reporting frustration. We will design your dashboard and give you a fixed quote within 48 hours.

Based in Melbourne, serving all of Australia
Fixed quotes within 48 hours
No lock-in contracts
Get in touch

No spam. No pressure. We will respond within 24 hours.